


The Dataset has been Stalking me on LinkedIn - Datasaurus Dozen
According to my timeline*...

I’ve seen it, you’ve seen it and we all will probably continue to see this GIF on Linkedin till the heat death of the universe.
For those who haven't (until now), the above GIF is constantly used as a hook by various AI/ML/Statistics LinkedIn influencers to remind people to visualize data. In their defence, it's a great hook - why is someone using a T-Rex to explain statistics?
But what I and probably everyone else love about this GIF is how easily and aesthetically it conveys its message. 9 seconds, 13 distinct images and barely any change in 5 statistical measures. Mindblowing. You don't need to read the post's caption before you get the message. Don't trust summary statistics, always visualise data. If this doesn't burn it into your memory, nothing will.
Don't trust summary statistics, always visualise data.
And it was burnt into mine, the first time, the second time, the third.....and as of writing this the sixth! And it's gotten annoying. Not because I constantly see it but I never saw credit attributed to the original authors. So I'm here to fix that for me and you.
Along the way, we’ll learn about some interesting people and history.
The Origin
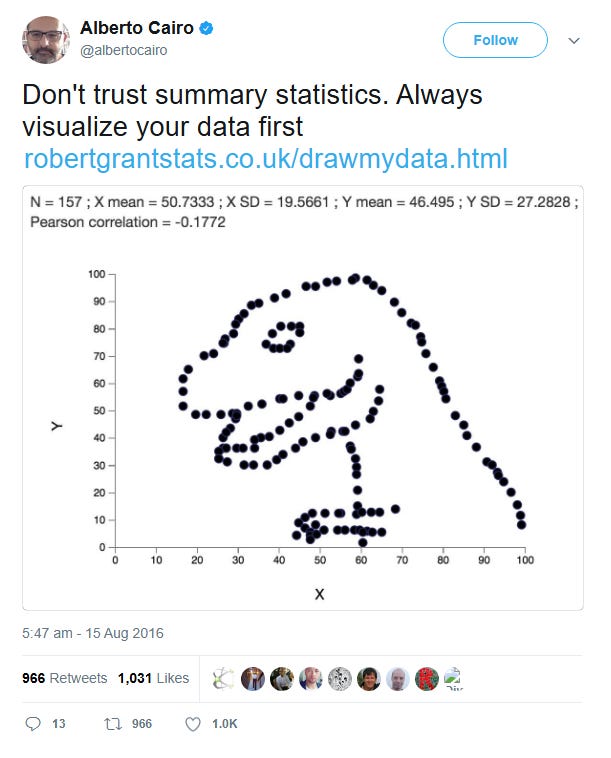
The first dinosaur plot in the GIF came from a tweet by Alberto Cairo on Twitter in 2016. He created the image using a dot plotting tool developed by Robert Grant. The tool allows you to manually input points and shows their collective statistical properties.
The above image statically conveys how easy it is to miss the big picture with summary statistics. Sure the mean is around 50 for X and Y, has 157 data points and the standard deviation is higher on the Y axis. But who cares, the data is the outline of a T-Rex! It is now fondly called the Datasaurus.
After this made the rounds on Twitter Alberto’s post seems to have come in contact with 2 Researchers at Autodesk - Justin Matejka and George Fitzmaurice. They asked to use his dataset for their project and he obliged (after recreating a version for them). They planned on infusing the image with a theme from a dataset called Anscombe's quartet.
The Starting Point
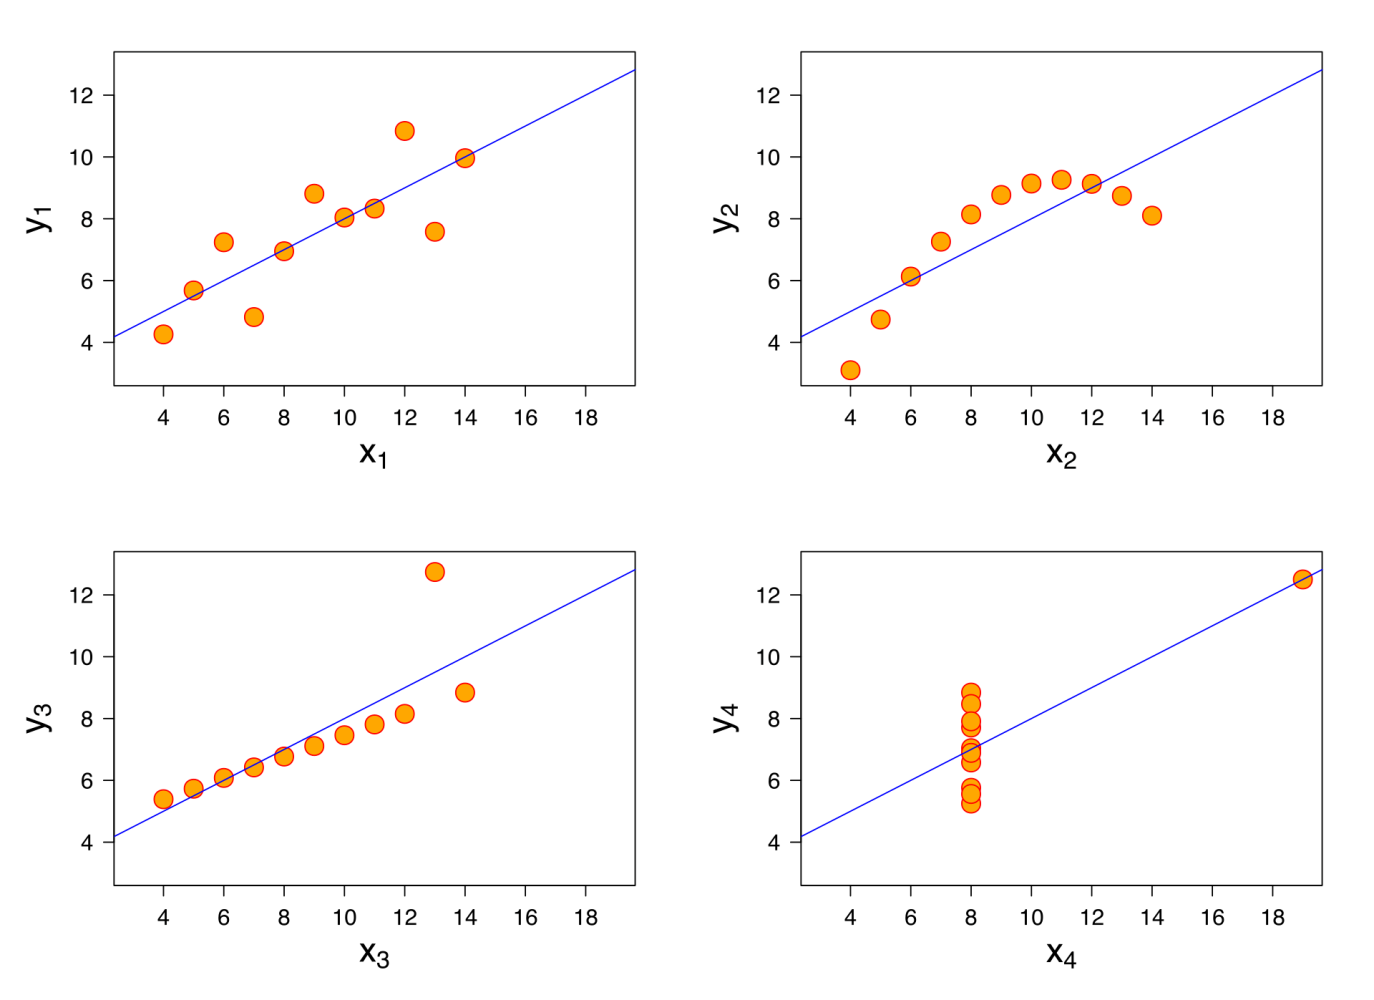
Despite not looking as striking as our infamous GIF these 4 plots pack a punch. While looking visually dissimilar, they all share the same mean and deviation in the X and Y axis, Pearson correlation, regression line and coefficient of determination. The statistician Francis Anscombe shared this in a paper in 1973 to illustrate the importance of graphing data.
Although plotting data is par for the course these days, statisticians in Ansombe's time were still new to computers and graphing and thus seemed to focus on statistical methods. It gives context to when he wrote “Graphs are essential to good statistical analysis” and “A computer should make both calculations and graphs”.
Justin and George repackaged this old idea in a new way by starting with the Datasaurus then generating the subsequent visually distinct sets that matched the 5 statistical properties. It was done rather ingeniously.
The Extrapolation
This process starts with an initial dataset and a target shape. The algorithm then makes small, random changes to individual data points, with a bias towards the final shape. After each change, the algorithm checks if the statistical properties remain within an acceptable range of the original values. If they do, the change is accepted; if not, it's rejected.
The below image shows some of the stages of Datasaurus being morphed into some of the distinct final images after 200, 000 iterations.

But the devil is in the details. Early in the process, the algorithm is flexible, accepting changes that move points closer to the target, even if they slightly change the statistical details. Over time, the algorithm becomes more selective, only accepting changes that closely maintain these properties. The process continues until the dataset closely resembles the target shape or until no further improvements can be made without violating the statistical constraints.
Borrowing from metallurgy, the authors termed the parameter that controls the gradual tightening of the statistical tolerance "temperature" and have called this overall process “Simulated Annealing”. And the Datasaurus Dozen was born!

In my research, I found out this dataset was quite popular among statisticians and mathematicians in blogs and videos since its publication in 2017. It still pops up in many personal blogs and online publications in recent years (especially in my LinkedIn feed for some reason).
The dataset has been used and analyzed across multiple programming languages. It was archived into an R package. A generalized implementation of the process that can work with arbitrary input and output datasets was created by Stefanie Molin in the Python - Data Morph. In her presentation on the package, she discusses how she added additional implementation options and optimised the code. In the future, some poor soul out there will probably find a reason to do something with this dataset in Rust too.
The Ending Point
I’m glad I got to use my frustration and curiosity (but mainly frustration) with this GIF to research this topic and come across such a rich history and some interesting people. I plan to follow the individuals mentioned in this article and see more of their work. I encourage anyone else interested in machine learning, statistics and visualization to do the same - Alberto’s book “How Charts Lie” is already on my reading list.
Writing this has also made me want to read more history, especially in engineering and data analysis. There are a lot of principles and ideas buried there that still apply today. Sometimes these old ideas need to be refreshed to communicate them to a newer audience. I’m glad Justin and George did a nice refresh on Anscombes Quartet for us all.